Small number with surprisingly large consequences
Why the government choice of discount rate should interest everyone
Angus Hanton, December 2010
The British economy is burdened by huge liabilities, but the size of these cannot be reliably estimated without choosing an appropriate discount rate. This rate is needed to put the costs of paying future liabilities into present-day terms. Whatever discount rate is used will certainly affect public servants’ pensions contributions and benefits, but it should also impact policy decisions for both capital and current expenditure, and it will indirectly influence the wider UK economy. It is surprising therefore that the subject receives so little attention but it is now very topical for two reasons:
- The coalition government is radically reviewing pensions for public employees, and as part of that it is consulting on what discount rate to use for government pension schemes.
- There is a determination in government to account more rigorously for its longer-term liabilities many of which have until now been outside the scope of UK national accounts.
Lord Hutton’s interim report of October 2010 from his Commission on Public Service Pensions stressed two points: that pensions contributions have been much too low for many years and that the amount by which they should be increased will be largely determined by the discount rate chosen – a lower rate leads to a higher valuation of the future liability and therefore larger increases in required contributions. The report emphasises that the “current discount rate [3.5%] is clearly at the high end of the spectrum” (1).
Small changes in the discount rate can make an enormous difference to the present-day value of longer-term liabilities as this table shows:
Present-day value of £100 in 35 years at various discount rates
|
Liability amount |
100 |
100 |
100 |
100 |
100 |
100 |
100 |
100 |
|
Discount rate % |
0.0 |
0.5 |
1.0 |
1.5 |
2.0 |
2.5 |
3.0 |
3.5 |
|
approx discount factor |
1.00 |
0.84 |
0.70 |
0.59 |
0.49 |
0.41 |
0.34 |
0.29 |
|
“present value” of liability |
100 |
84 |
70 |
59 |
49 |
41 |
34 |
29 |
One can see that a rate of 1.5% reduces the value of £100 of liability in 35 years to £59 today whereas a higher discount rate of 3.5% brings it down to only £29. In other words, a decrease in the discount rate from 3.5% to 1.5% more than doubles the present-day size of this future liability.
Effect of lower discount rates on government pension liabilities
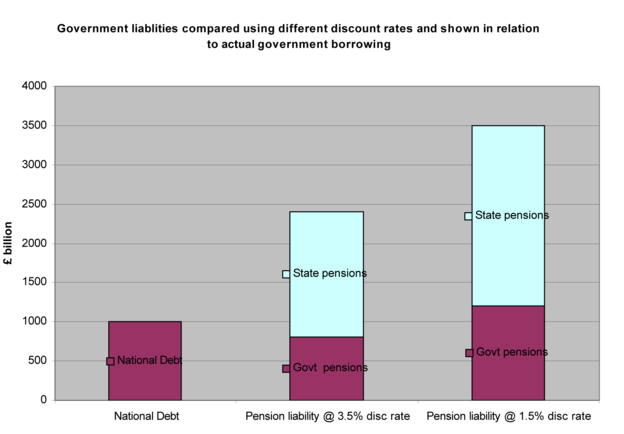
Of all the government’s future liabilities the largest by far is its pension commitment of several trillion pounds, officially with a present-day value of about £2,200,000,000,000 (£2.2 trillion or about £90,000 per UK household), but if a lower discount rate is used the present-day value of pension commitments would be very much higher (2). This liability is in two parts – pensions for public service employees and the state pension. Hutton is only reviewing the first of these but the state pension commitment is even larger, although it is rarely analysed in detail – even in 2005 the Government Actuary’s Department estimated it at £1.35 trillion using the 3.5% discount rate. This liability must now be well over £1.6 trillion when future liabilities are discounted at 3.5% and would be much more at a lower discount rate. The graph below illustrates how important these twin government pension liabilities are in comparison with the government’s official “National Debt” and it shows how much they increase with the use of a lower discount rate. (3)(4).
Discount rates used in the public sector have varied and have fluctuated sharply over time: for example the Nuclear Decommissioning Authority now uses a rate of 2.2% to reduce its liabilities from an undiscounted estimate of £77bn to a present value of £44bn. Others often use rates of 3.5%, or higher, and even within schemes rates used can vary: the Local Government Pension Scheme used discount rates at March 2007 that ranged between 2% and 4.35%. The Principal Civil Service Pension Scheme has in recent years used the following assumptions, illustrating how discount rates employed have fluctuated sharply whilst other assumptions have been kept stable (5):
| Date: 31 March | 2010 | 2009 | 2008 | 2007 | 2006 |
| Assumed annual increase in salaries | 4.25% | 4.25% | 4.25% | 4.25% | 3.9% |
| Inflation assumption | 2.75% | 2.75% | 2.75% | 2.75% | 2.5% |
| Discount rate used | 1.8% | 3.2% | 2.5% | 1.8% | 2.8% |
A 25-year-old government employee may reasonably expect still to be drawing his or her pension in 60 years’ time: the present-day value of a payment of £100 in 60 years would jump from £14 to £34 if one used the 2010 rate rather than the 2009 rate. Such abrupt fluctuations in the government’s assessment of its own liabilities might puzzle uninitiated observers.
There are two different routes which central government has used recently to determine its discount rates: the “Green Book” produced by the Treasury and the use of accounting standards, such as FRS17. These are completely different in their reasoning: the Green Book uses a theoretical model, whilst FRS17 uses a bond market rate.
What is the Green Book?
This is a set of rules, last revised in 2002, using cost benefit analysis to guide decision making. It aims “to encourage an …. analytically robust approach to appraisal and evaluation” in government decision making and is important as this is used throughout government. The Green Book uses a discount rate that it describes as the Social Time Preference Rate (STPR), and is quite explicit on how it arrives at its rate of 3.5% (6).
Its STPR is made up of three parts, which are then added together: (i) the rate at which individuals typically discount future consumption over current consumption; (ii) a catastrophic risk element; and (iii) an additional measure that reflects society’s increasing wealth.
In measuring people’s preference for current consumption the Green Book takes the “pure time preference” of individuals, based on research mainly done in the 1970s and 1980s, and it assumes it to be about 0.5% per year. This is the part of the STPR that reflects a typical individual’s preference for consumption now rather than in the future. It then adds the element called “catastrophe risk”: this is the risk that “there will be some event so devastating that returns from policies, programmes or projects are eliminated.” This is intended to cover natural disasters and major wars, and it settles on a rate of 1% per year for this risk. The final component of the Green Book rate reflects the increase in society’s wealth, and is mainly based on the observation that over the period from 1950 to 1998 UK per capita growth was 2.1%, so a rate of 2% is adopted to reflect society’s increasing ability to meet its obligations.
The Green Book therefore advocates a discount rate which is the pure social time preference (0.5%) plus the catastrophic risk (1%) plus the approximate annual growth in per capita income (2%), giving a total discount rate of 3.5%. This is a real discount rate and inflation is to be accounted for separately.
Rather than a uniform discount rate, the Green Book argues that for longer periods (over 30 years) a lower rate should be used because of “uncertainty about the future”: this is clearly relevant to liabilities such as pensions and measures relating to climate change. For the longer term, it suggests discount rates of 2% for periods such as 150 years and declining to only 1% for periods over 300 years.
There have been serious criticisms of the Green Book approach. The Stern Review of the economics of Climate Change was concerned that climate change could lead to irreversible wealth transfers between generations and therefore it was thought not justifiable to use rates of social time preference which were really reflecting the selfish preferences of the current generation. But Stern also gives a very much lower rating to the component reflecting catastrophic risk and takes a figure of one tenth of this, at 0.1% - and even this he considered generous. It is true that the Stern Report’s catastrophe figure is worded to reflect the most severe catastrophes - “future events resulting in human extinction” (7).
Another major area of concern is the assumption of indefinite 2% per annum growth. Many economists are uncomfortable about using this assumption, especially in the light of recent economic pressures and the large imbalances between Europe and the BRIC countries. However, there is also a particular problem with using this growth assumption when discounting pension liabilities: it is arguable that rising wealth itself contributes to rising life expectations in various ways, of which the most obvious is the ability of medical care to save lives and extend life spans. Perhaps if economists are assuming a 2% increase in national wealth, then actuaries should be assuming greater increases in life expectations than they are currently doing.
The alternative governmental approach is based on an accounting standard using a market interest rate.
How does the Financial Reporting Standard (FRS17) determine the “right” discount rate?
The idea of using a market rate is that this will reflect the extent to which capital markets value present over future consumption. FRS17, adopted in 2006, advocates using the interest rate on AA corporate bonds (8).
FRS17 was drafted for use by fully funded schemes with actual investments in the private sector. It says, for example, in justifying its choice of discount rate (my underlining):
“… the expectation is that a higher rate of return on equities compared with that on less risky investments will make such promises affordable.”
“…if necessary the employer could, in many cases, give lower than expected increases in benefits … in extremis the employer could even close the scheme down. …These options make the liability less onerous and can be reflected by using a discount rate higher than the risk free rate.”
The idea that equity returns will justify a higher rate than the risk-free rate, or that a scheme could be closed down, are obviously not applicable to unfunded government schemes, which shows how inappropriate it is to use this discount rate for most existing government pension schemes.
Another argument for using FRS17, and its corresponding International Accounting Standard (IAS19), is that it allows for consistency and harmonised accounting, but given the importance of choosing the right rate this is unconvincing if the underlying reasoning is flawed.
Serious practical problems arise with using the AA corporate bond rate such as its volatility (as illustrated earlier in the table from the Civil Service Scheme), which can lead to massive year-to-year changes in a scheme’s liabilities. For example, the change over the last year in the AA bond rate from 3.2% to 1.8% increased the liabilities of one particular government scheme from £115 billion to £153 billion. More fundamentally, the AA corporate bond rate reflects risks of corporate default, which are larger than those reflected in the rates on, say, government bonds. There are also questions around the levels of inflation that corporate bond investors are assuming.
Fluctuations arising from the use of these accounting standards, combined with changing corporate bond rates, also have very significant consequences for the private sector. Many private pension funds hedge their “liabilities” by investing in government gilts and corporate bonds (or equivalent swaps) with the express intention of matching their investments with their accounting liabilities – as bond yields rise their liabilities under FRS17 fall along with their assets. In this tail-wags-dog example real investment decisions are being driven by a particular accounting standard used to assess liabilities.
Government should be using the risk-free rate, or real gilt yield
The theoretical rate that should be used by the government is the real risk-free rate of return on capital, and the obvious rate to use is the real interest rate that the government pays for its borrowing. This would be the annual yield on index-linked government gilts, which is currently under 1%. This approach was adopted by consulting actuaries, Towers Watson, in their March 2010 assessment of the pension liability for government employees where they used the index-linked gilt rate of 0.88% (9). Illustratively, in the recent auction of index linked gilts on 17th November 2010, the yield was 0.78% and many economists cannot see why a discount rate above 1% should be used currently.
Another approach is to ask how the market values these liabilities. This is indeed possible as some state pension providers have chosen to pay a lump sum to get their liabilities taken on by large private pension schemes. This means one can check what rate is used when agreeing a price for these transactions. It turns out that negotiators, in assessing the liabilities, use the gilt yield minus about 0.25%, which gives a direct capital market perspective on the “right” discount rate to use: near to, or even below, the real gilt yield.
Large scale of the unfunded, and sensitive, pension liabilities
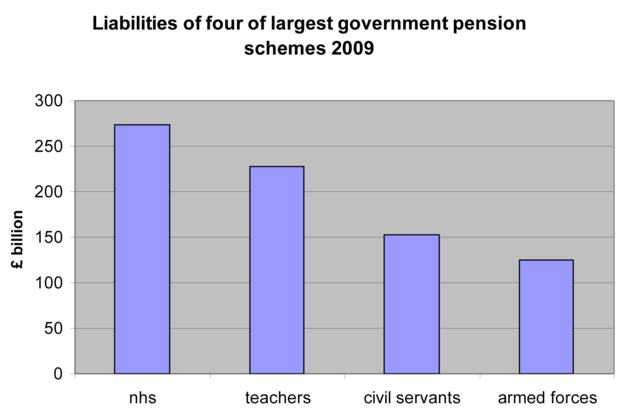
The various pension schemes for government employees are enormous and together cover 12 million people including dependants. Four of the largest are the schemes for the NHS, Teachers, Civil Service and Armed Forces, whose combined liabilities have a present-day value of over £800 billion. All these schemes are unfunded.
Source: ONS, HMRC, adjusted, using a discount rate of 1.5%
There is a case for each pension scheme doing a sensitivity analysis to work out what their liabilities would be at different discount rates, as is done in the US. However, in December 2007 the UK Treasury considered this approach but concluded it would be too hard to explain (“onerous additional narrative”) and decided simply to require reporting statements to emphasise how “even small changes in assumptions may affect the value of the liability”. Currently the Treasury has consciously decided not to require a sensitivity analysis and these schemes do not even state their undiscounted liabilities (10). The role that senior civil servants have played in managing these rules is somewhat under the spotlight, especially when one notes that the majority (58%) of the Principal Civil Service Scheme members contribute only 1.5% of their salaries to earn their pensions, with government contributing 20% (11). Civil servants in their 40s and 50s expecting to retire at 60 are likely on average to have a 30-year retirement.
How often should the rate be reviewed and by whom?
If a discount rate is chosen that relates to a market value, such as index-linked gilt yields, when should this be reset? One solution would be to have an official discount rate set each fiscal year and announced as part of the budget statement. Given the political and economic significance of the choice of rate perhaps this decision should be entrusted to an independent body, as the setting of interest rates is delegated to the Bank of England’s Monetary Policy Committee.
The impact of using lower discount rates on pensions could be enormous and specifically it looks as if it may well lead to very sharp increases in government employee contributions and reductions in benefits, including a reduction in the rate at which pensions benefits accrue for existing workers. Large increases in contribution rates from salaries, as suggested by the Hutton report, will make confrontations between government and unions inevitable.
As the discount rate is reviewed it becomes clear how generous the government pension schemes have been. Apart from questions of fairness, such pensions create financial handcuffs for government employees, who cannot then easily move into the private sector, creating rigidity in the employment market. For example, the government’s recent proposal to allow Health Service workers to set up “mutual companies” which will get them off the payroll is only workable if they are allowed to stay in the NHS Pension scheme.
Conversely, in terms of the state pension, which is now one of the lowest in Europe, lower discount rates would make the projected liability much higher and would demonstrate that the state pension is very unlikely to be increased in real terms. Even private pension schemes are likely to be affected: if they follow the government into using lower discount rates their employee contributions will need to increase sharply and benefits be reduced.
The Whole of Government Accounts (WGA) are currently being formulated and the government plans to produce the first set of such accounts by the end of 2011 (12). Any reduction in the discount rate will affect most of the large items with increases in the present-day liabilities for Nuclear Decommissioning and for the Private Finance Initiatives (PFI). These accounts will also include the value of government guarantees and contingent liabilities, which in total are over £500 billion: these figures too will be increased by the use of a lower discount rate.
Projections as to which government expenditure is worthwhile would also be affected by a new basis for assessing future costs and benefits: for example, a lower discount rate should allow more expenditure on climate change measures as it would attribute more present-day value to likely future benefits. This illustrates how the discount rate is at the heart of many government decisions which involve choosing between current consumption and future benefits.
Large hidden subsidies and intergenerational issues
The use of lower discount rates may also raise tensions in areas where similar services are provided by the both the private and public sectors, such as teaching and medical care. For example the teachers at private schools are included in the government’s Teachers’ Pension Scheme and this means there is a state subsidy to private schools (or their teachers) of about £130 million each year. With a discount rate of 1% this subsidy increases to over £400 million, which will provoke those who have strong views on private education. The lower discount rate will also expose a regional issue with the pension subsidies: a disproportionate number of high-earning members of these schemes live in the South East of England so that these pension subsidies exacerbate the problem of the North-South divide. In the case of medical care similar issues arise with doctors who also offer private treatment – the fact that their pensions are underwritten by the state is well understood, but a lower discount rate would reveal that these are more heavily subsidised by the government than generally realised.
Some people consider that choosing a discount rate is only a matter of dry accounting and that discount rates are selected for specific purposes, such as making a scheme’s liabilities approximate to its assets. In fact the choice of discount rate is a matter of much greater significance and it has large intergenerational implications: using a rate that is too high, as many people feel has been done in the recent past, can easily halve the present-day estimate of liabilities. As long as too high a rate is used it will hide large transfers of liabilities from the older to the younger generation.
Working out the real costs of government enterprise
Reducing the discount rate also has a political dimension in relation to the size of the state. If a significantly lower discount rate is adopted, this will push up the recognised costs of employing staff, and parts of government which have generally been said to be near breakeven (such as the Royal Mail or Forestry Commission) will be seen to be much more loss-making than previously thought: more realistic rates recognise the true costs of pensions. To quantify this in round terms, if the consequence of the lower rate is that pension contributions need to be increased by at least half from the typically current 6% (employees) and 14% (employer) to 9% and 21%, that would represent a cut in pay for employees of about 3% and a rise in government costs for its employees of about 7%. This increase in recognised costs would be the direct consequence of using a discount rate nearer to the risk-free rate.
Thus a review of the appropriate rate has consequences for both current and future policy decisions, but it also allows a more accurate look at the recent past. If the rate used over the last few years has been too high then many calculations on government spending have been badly understated. For example, increasing the number of health service workers over the last few years has officially increased the percentage of GDP spent on Health from 3.5% in 1949/50 to 7.3% in 2007/8. However if the discount rate used has been too high then NHS pension costs may have been understated by so much that actually health spending has increased by an extra 1%. Put another way, we may have been spending 10% more on the NHS than we thought.
Conclusion – will Pandora’s box be opened?
In the past, discount rates have arguably been set in ways that make them too high and inclined to fluctuate. The government’s current review of the “right” discount rate for its own pension schemes will probably lead to the use of a rate that is somewhat lower and more stable and this is likely be widely copied in both the public and private sectors. If it is set much lower, near to the theoretically correct risk-free level, it will challenge past assumptions about government’s real costs, will raise very hard questions about the affordability of pensions and expose the true scale of the liabilities being pushed onto the next generation. On the other hand, if the discount rate is set at too high a level the government will be guilty of false accounting.
References and notes:
- Independent Public Service Pensions Commission Interim Report 7.10.2010 http://www.hm-treasury.gov.uk/d/hutton_pensionsinterim_071010.pdf
- ONS’s Pensions Trends and summarised in Edmund Conway’s article of Dec 2009 http://www.telegraph.co.uk/finance/newsbysector/banksandfinance/6771822/Taxpayers-face-2-trillion-unfunded-pensions-liability.html
- National debt estimates with different assumptions, Dave Hobbs, ONS, section 3 of “Wider Measures of Public Sector net Debt” http://www.statistics.gov.uk/articles/nojournal/wider-measures-public-sector-debt.pdf
- £1 Trillion black hole – Public Sector Pension Liabilities, April 2010, by Angus Hanton http://www.economicpolicycentre.com/2010/04/19/government-pension-liabilities-understated-by-1trillion/
- Cabinet Office: Civil Superannuation Resource Accounts 2009/10 sctn 24.1.3, page 39 http://www.civilservice.gov.uk/Assets/2009-10%20Resourcse%20Accounts_tcm6-36925.pdf
- The Green Book, Treasury document:http://www.hm-treasury.gov.uk/data_greenbook_index.htm
- Stern Review on Climate Change http://www.hm-treasury.gov.uk/stern_review_report.htm
- FRS17: http://www.frc.org.uk/asb/technical/standards/pub0206.html
- Towers Watson report of March 2010: http://www.towerswatson.com/united-kingdom/press/1418
- Treasury discussion on pension disclosures: Paragraph 7 of,http://www.hm-treasury.gov.uk/d/frab89_pensions_disclosures.pdf
- Relative contributions of employee and employer in Civil Service Scheme from report to March 2010, page 11: http://www.civilservice.gov.uk/Assets/2009-10%20Resourcse%20Accounts_tcm6-36925.pdf
- Wider Measures of Public Sector Debt:http://www.statistics.gov.uk/articles/nojournal/wider-measures-public-sector-debt.pdf